Men’s weight and waist statistics in England: HSE 2024
Seven in ten men aged 16 and over in England were estimated to have overweight or obesity in Health Survey for England 2024. This is an England survey—not a combined UK estimate, not a measure of SHIFT members and not evidence of treatment results.
This reference page compiles published NHS statistics so readers and journalists can check the numbers, definitions and limits. The survey year is 2024; NHS England published the report on 27 January 2026. SHIFT did not conduct the survey. [1]
The nine figures, with their units intact
| Indicator | Group | Estimate | HSE table |
|---|---|---|---|
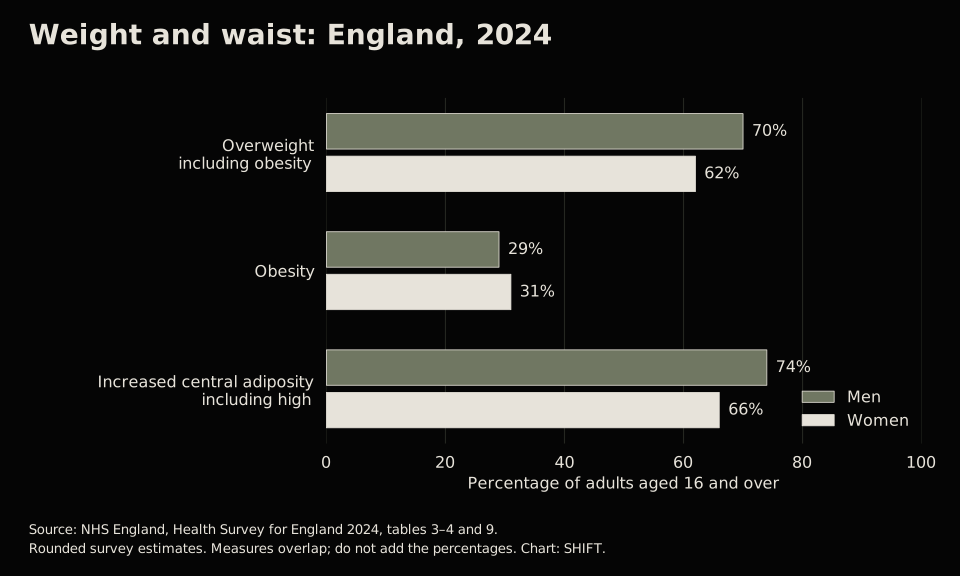
| Overweight including obesity | Men | 70% | 3 and 4 |
| Overweight including obesity | Women | 62% | 3 and 4 |
| Obesity | Men | 29% | 3 and 4 |
| Obesity | Women | 31% | 3 and 4 |
| Increased including high central adiposity | Men | 74% | 9 |
| Increased including high central adiposity | Women | 66% | 9 |
| Mean measured weight | Men | 86.2 kg | 1 and 2 |
| Mean waist circumference | Men | 98.4 cm | 9 |
| Mean waist-to-height ratio | Men | 0.56 | 9 |
Each number is retained in the original units. [1] Download the nine-row CSV · Download the accessible SVG chart. The downloadable extract was checked on 13 September 2026; this article and its interpretation were updated on 19 September 2026. The underlying values have not been changed.
Three distinctions that change the story
“Overweight including obesity” is not the obesity rate. Men’s 70% includes the 29% living with obesity. Do not write that “70% of men are obese”. The reported obesity estimate is 29% for men and 31% for women, even though the combined overweight-or-obesity estimate is higher for men. [1]
A percentage-point gap is not a relative percentage change. The difference between the rounded 70% and 62% estimates is eight percentage points. It is not evidence that prevalence rose by 8%, because these are two groups in the same survey, not two years. We have not tested the difference for statistical significance.
An average waist is not an ideal waist. The men’s mean of 98.4 cm describes the measured sample estimate. It is not a personal health target, a trouser label or a threshold that makes someone safe below it. The same caution applies to the mean measured weight of 86.2 kg. [1]
BMI and waist answer different questions
The source defines overweight including obesity as BMI at least 25, obesity as BMI at least 30, and increased including high central adiposity as a waist-to-height ratio of at least 0.5. The waist-based estimate is not simply a second count of the same BMI category. [1]
For personal health, the NHS explains using waist-to-height ratio alongside BMI when BMI is below 35. The calculation is waist divided by height in the same units. For example, 90 cm divided by 180 cm is 0.5. That arithmetic is an illustration—not a diagnosis or an individual treatment decision. [4]
Use a personal measurement to start a health conversation, not to decide medication eligibility from a population average. A clinician can interpret your history and other risk factors.
Methods: who was measured, and what is missing?
HSE covers people living in private households in England. The 2024 survey interviewed 9,220 adults; 4,966 adults had a health visit. Those are overall participation counts, not the denominator for every table cell. Fieldwork extended from January 2024 to March 2025. [2]
The figures are weighted estimates with sampling uncertainty. Use the original tables for sample bases and confidence intervals before making a statistical comparison. Weighting improves population representation but does not make a sample a census or remove every possible source of bias. The report’s quality statement explains coverage and response limitations. [2] [3]
This page does not manufacture a UK total by combining England with Scotland, Wales and Northern Ireland. Their surveys can differ in year, population and measurement method. People outside private households are also outside this survey’s coverage. [3]
Take extra care with a trend chart: the 2021 BMI series used self-reported measurements and is not directly comparable with the usual measured series; no HSE survey ran in 2023. Do not fill that missing year with an invented value or treat the 2026 publication date as the year participants were measured. [2]
A claim a reader can actually verify
Health Survey for England 2024 estimated that 70% of men aged 16 and over in England had overweight or obesity.
That wording retains the survey, year, population, geography and combined definition. It avoids implying that SHIFT collected the data, that the percentage describes all UK men, or that a specific medicine changes the result.
Suggested reference: NHS England, Health Survey for England 2024, Adults’ overweight and obesity, published 27 January 2026, tables 1–4 and 9. Selected figures compiled and charted by SHIFT Newsroom; interpretation updated 19 September 2026.
Before publishing a headline, check the original table, keep the unit with the number, and distinguish a count, percentage, average and change over time. Our chart is a single-year comparison, not a forecast or an evaluation of a health programme.
Open the source chapter · Open the full data tables · Download CSV · Download SVG
What this means for a reader—not just a headline
These figures make men’s weight and waist worth discussing without turning a whole population into a stereotype. They cannot tell why an individual gained weight, whether he is motivated, or which treatment would help him.
For a personal starting point, explore the weight-management guide or read about mental health and weight. For a factual correction, send the figure, page link and supporting source to hello@shiftsometimber.co.uk; do not send personal medical records.
Common questions
Are these UK obesity statistics?
No. These figures describe adults aged 16 and over living in private households in England. The retained URL does not turn them into a UK-wide estimate.
Is 98.4 cm a healthy target waist for a man?
No. It is the survey’s mean measured waist circumference for men, not a personal target or a prescribing threshold.
Why does a 2024 survey have a 2026 publication date?
The survey year and publication date are different. The HSE 2024 report was published on 27 January 2026; fieldwork extended into March 2025.
Sources and editorial responsibility
- NHS England: HSE 2024, Adults’ overweight and obesity
- NHS England: HSE 2024 introduction and methods
- NHS England: HSE 2024 data-quality statement
- NHS: overweight and obesity, BMI and waist-to-height ratio
Product information and access arrangements can change. Use the original source and your treating service for decisions about your care. How SHIFT prepares articles · Report a factual correction.
What changed on 19 September 2026: Kept all nine source values and downloads; added claim-checking, percentage-point interpretation, survey limits and a clearer England-versus-UK distinction. No new survey or treatment-effect claim.